An Fe-C phase diagram that showcases the microstructures discussed below.
The iron (Fe)-carbon (C) phase diagram is shown above. There are a few things you may notice or recognize about this phase diagram. First, alloys of iron and carbon are commonly referred to as steel. In truth, steels only contain up to about 2 wt% carbon, while alloys with more carbon, generally 2.5-4 wt%, are reffered to as cast irons. Another thing that may stick out is that the maximum composition listed is 6.7 wt% carbon. The reason for this is that Fe3C, commonly referred to as cementite, forms a line compound at 6.7 wt% carbon and materials with greater than this much carbon are not generally useful in industry. Although the diagram does not go all of the way to 100% carbon, the calculations discussed in the section on the lever law can be applied to this shortened diagram, as well as other diagrams which may be presented without the full composition range.
Fe-C Phase Diagram
The Fe-C phase diagram is an important tool for the steel industry. Engineers use this diagram to design treatment techniques to produce steel that can perform in its desired applications. Notice that the composition of carbon only goes to 6.7 wt%. Most design mixtures in the steel industry will never go beyond 6.7 wt% carbon because the alloy turns into graphite, which is not useful in this industry.
The Fe-C diagram showcases a variety of invariant points:
Eutectoid Steel Microstructure
Consider a sample of steel with a carbon composition of 0.76 wt % (eutectoid composition). When cooled in equilibrium from the austenite phase, a lamellar pattern of ferrite and cementite form a microstructure called pearlite. When the carbon composition is in a range of 0.022-0.76 wt% and a similar cooling pattern takes place, this is termed hypoeutectoid steel. Once cooled, a heterogeneous microstructure is produced containing pearlite and ferrite. The other side of the eutectoid is termed hypereutectoid steel (0.76 wt% C - 2.14 wt% C). The same cooling pattern produces a pearlite and cementite microstructure.
Steel Treatments
Engineers often heat treat steel by heating samples into the austenite phase and cooling it. The rate of cooling determines the product's microstructure, and thus, it's properties. A very slow cooling will produce pearlite (as mentioned in the above paragraph); a moderate cooling rate will produce bainite; and a high cooling rate (quenching) will produce martensite. Depending on what the steel product will be used for, different treatment techniques are used.
Fe-C Phase Diagram
The Fe-C phase diagram is an important tool for the steel industry. Engineers use this diagram to design treatment techniques to produce steel that can perform in its desired applications. Notice that the composition of carbon only goes to 6.7 wt%. Most design mixtures in the steel industry will never go beyond 6.7 wt% carbon because the alloy turns into graphite, which is not useful in this industry.
The Fe-C diagram showcases a variety of invariant points:
- Peritectic: Delta iron + Liquid ⇢ Austenite
- Eutectic: Liquid ⇢ Austenite + Cementite
- Eutectoid: Austenite ⇢ Ferrite + Cementite
Eutectoid Steel Microstructure
Consider a sample of steel with a carbon composition of 0.76 wt % (eutectoid composition). When cooled in equilibrium from the austenite phase, a lamellar pattern of ferrite and cementite form a microstructure called pearlite. When the carbon composition is in a range of 0.022-0.76 wt% and a similar cooling pattern takes place, this is termed hypoeutectoid steel. Once cooled, a heterogeneous microstructure is produced containing pearlite and ferrite. The other side of the eutectoid is termed hypereutectoid steel (0.76 wt% C - 2.14 wt% C). The same cooling pattern produces a pearlite and cementite microstructure.
Steel Treatments
Engineers often heat treat steel by heating samples into the austenite phase and cooling it. The rate of cooling determines the product's microstructure, and thus, it's properties. A very slow cooling will produce pearlite (as mentioned in the above paragraph); a moderate cooling rate will produce bainite; and a high cooling rate (quenching) will produce martensite. Depending on what the steel product will be used for, different treatment techniques are used.
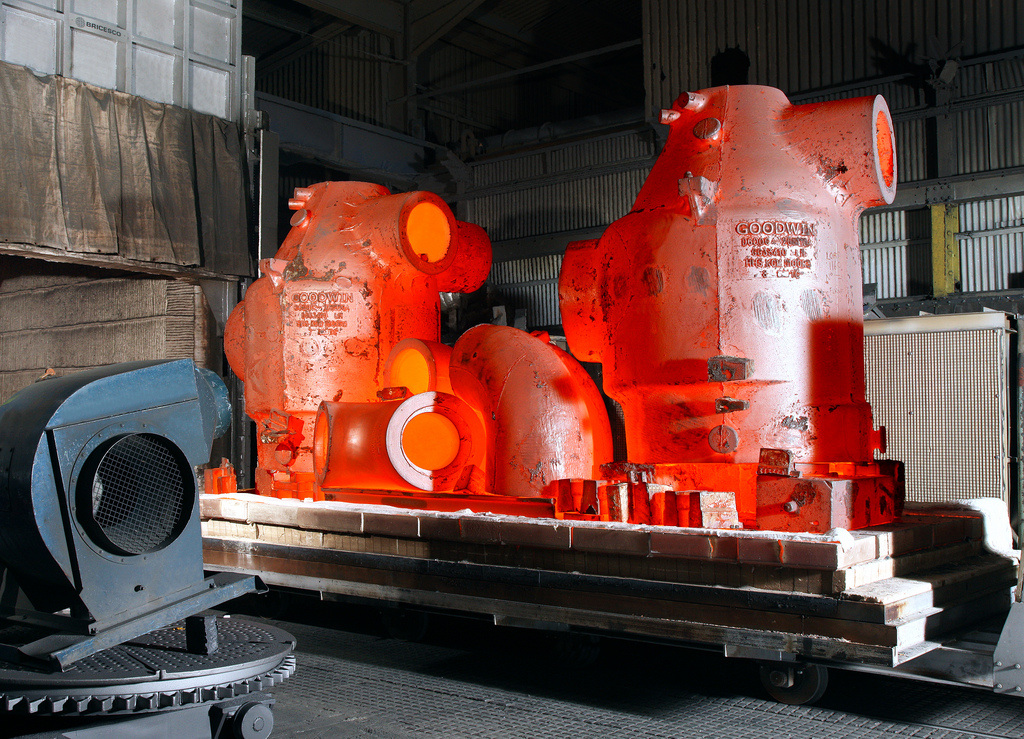
A steel product cools after undergoing 12 hours of 1,200°C heat treating. (Image taken from wikipedia.org)
