Phase Diagrams: What they are and Why you need them
Phase diagrams are important tools for materials scientists, materials engineers, and anyone who needs to understand the behavior of a specific material or alloy. The behavior and properties of a material vary with conditions such as composition, temperature, and pressure. A phase diagram allows scientists and engineers to predict the properties of a material under these types of conditions so that the material may be used in its expected applications. Phase diagrams are also guides for heat treatments, for fabricating materials/alloys, and for creating new materials.
Phase
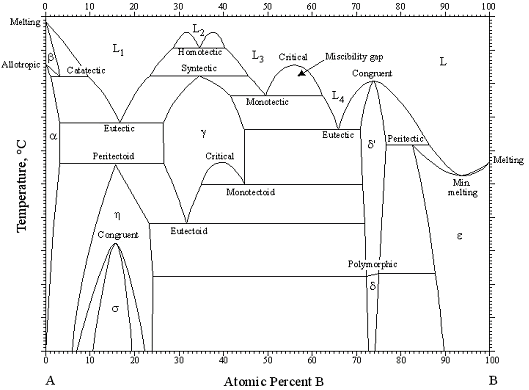
A phase is a specific space in which a material is homogenous or uniform. For example, water may exist in its solid phase as ice and in its gaseous phase as steam. For an alloy such as steel, there is a ferrite phase, austenite phase, ferrite + cementite phase, a liquid phase, and others. The phase gives insight into the microstructure of the material.
Equilibrium
Phase diagrams display information that is at equilibrium. We know that water in its liquid form does not spontaneously freeze at 0°C; it takes time for the liquid to completely turn into solid ice. Viewing phase diagram information at equilibrium assumes that the material has had an infinite amount of time to reach its new phase with the changing conditions. Equilibrium is why phase diagrams have distinct boundaries between phases.
Microstructure
The microstructure of a material depends on the phase which the material is currently in and how it reached that phase. Changes in microstructure are most easily seen in the cooling process. As a material cools in equilibrium from the liquid phase for example, microstructure changes as the material enters different phases. Engineers use a variety of techniques to achieve a desired microstructure. Techniques include annealing, quenching, tempering, etc.
Phase diagrams are important tools for materials scientists, materials engineers, and anyone who needs to understand the behavior of a specific material or alloy. The behavior and properties of a material vary with conditions such as composition, temperature, and pressure. A phase diagram allows scientists and engineers to predict the properties of a material under these types of conditions so that the material may be used in its expected applications. Phase diagrams are also guides for heat treatments, for fabricating materials/alloys, and for creating new materials.
Phase
A phase is a specific space in which a material is homogenous or uniform. For example, water may exist in its solid phase as ice and in its gaseous phase as steam. For an alloy such as steel, there is a ferrite phase, austenite phase, ferrite + cementite phase, a liquid phase, and others. The phase gives insight into the microstructure of the material.
Equilibrium
Phase diagrams display information that is at equilibrium. We know that water in its liquid form does not spontaneously freeze at 0°C; it takes time for the liquid to completely turn into solid ice. Viewing phase diagram information at equilibrium assumes that the material has had an infinite amount of time to reach its new phase with the changing conditions. Equilibrium is why phase diagrams have distinct boundaries between phases.
Microstructure
The microstructure of a material depends on the phase which the material is currently in and how it reached that phase. Changes in microstructure are most easily seen in the cooling process. As a material cools in equilibrium from the liquid phase for example, microstructure changes as the material enters different phases. Engineers use a variety of techniques to achieve a desired microstructure. Techniques include annealing, quenching, tempering, etc.
